The most time-consuming issue, I have found, in using any land surface model in grid mode is to deal with the grid-based files that are output (nowadays most usually NetCDF files). JULES is no exception in this. Here are some tips that I hope people will find useful.
Here we assume that your output files are in NetCDF format (if they aren't, see comments about Xconv below and I suggest to convert to NetCDF straight away). The first thing to identify is whether your NetCDF files are 1D or 2D. See below for tools for:
(i) Viewing 2D files
(ii) Viewing 1D files and
(iii) Converting between 1D and 2D.
For general information about Data Visualisation, please see Emma Robinson's talk about Interpreting JULES Output at the 2016 JULES Short Course here and her examples in Python and R here. Also see the python package Iris.
|
PLOTTING 2D NETCDF FILES:
Here are some links for dealing with 2D NetCDF files (see also here). - On UNIX/Linux people seem to use NCview or perhaps GrADS (see also here and here), Xconv or Iris (see also Cube Browser and Thea). Note: Xconv can show pp files, which NCview can’t, and also convert to NetCDF if required (though the unix tool pptoncdf is generally better for that). - On Windows you can use Panoply (NASA's viewer package) or a GIS package like QGIS (see also here; has a lot of advantages if you want to compare JULES output to other raster or vector data, e.g. to calculate land surface fluxes over an irregular area like a river catchment). - You want to animate your NetCDF files, e.g. convert to a movie to include in a presentation? See here. |
|
PLOTTING 1D NETCDF FILES:
Gridded runs from JULES can output data in 2D or 1D NetCDF files. Most packages for displaying gridded data can handle 2D (see above), but relatively few can handle 1D (i.e. when there is a 'land axis'): - On UNIX/Windows you can always of course write a tailor-made script to read the 1D Netcdf file into an array and then plot it. I've done this a few times now, but for me has two important disadvantages: (1) Firstly, for large files you will hit memory constraints very quickly on a script. Moving to Fortran or C removes the memory limitation, but you then generally have much more limited graphics for displaying the data. (2) Secondly, it's very difficult to code something that is 'general' in the sense that it can parse the input file and read in the data irrespective of how many variables you have (e.g. if you have >30 in your JULES outputs), how many nonspatial dimensions it has (e.g. scpool, ntiles), what they are called (lat, latitude, latitude0, Latitude, lat_data, etc.) so you usually end up with something less than general and that means you need to recode it completely when you move on to the next application. - On UNIX/Linux you can use GrADS. You can display a 1D NetCDF file in GrADS if you can generate a .pdef file that correctly describes the grid of the datafile you have. See here for how to construct a pdef file for gridded output. I'm also told that you can get GrADS to output a 2D NetCDF file, which would mean that it can be used as a 1D -> 2D converter as well, but I don't know how to do that. Another option on UNIX/linux is xmgrace/grace. Another option is CFPLOT: see here. |
CONVERT 1D -> 2D NETCDF:
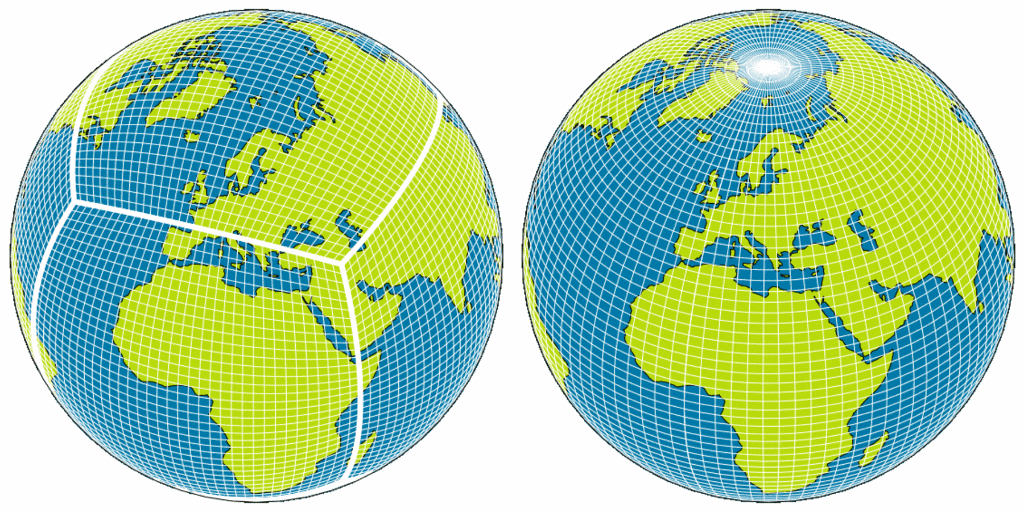
If you want to do more than just visualise your 1D output, however, you will usually have to convert to 2D. For grid conversions 1D -> 2D see some of the comments here (JULES outputs commonly referred to as '1D files' or 'land-axis files' are examples of unstructured grids). As far as I know, your options for conversion are as follows:
1) By far the easiest for the user is to avoid the need to convert 1D -> 2D by having JULES always output a 2D grid. See notes at the top of here for how to make sure that is specified.
2) Next easiest for the user I would say is to use vector_to_grid.py which is a Python program written by my colleagues at UKCEH that will convert 1D -> 2D at the end of a JULES run. This has been shared in the sense that it appears inside several publicly-available Rose suites on Rosie Go. Download e.g. suite u-cm641 and look in the directory app/vector_to_grid/bin to see how it works.
** Even though u-cm641 is my suite, I do not provide any support for vector_to_grid.py because I did not write that particular script **
3) Next easiest, use CDO tools to do the conversion (remapnn or remapcon).
(I have only included this option as a brief note: I do not myself have a generalised script that does this conversion. I am aware that the remapnn and remapcon commands can do it, but I find them uber-fiddly to use so this note is here just as a signpost to suggest that it's probably possible, but you will have to figure out how to do it yourself)
4) You can write a bespoke Python or R script to read in the 1D .nc file and output a 2D .nc file. There are several scripts like this authored by various people at UKCEH (and I've done it a couple of times too). However, the biggest problems I've found with this option are
(a) you run out of memory for even reasonably-sized NetCDF files (e.g. 1-2 Gb) and
(b) it is very difficult to write a routine like this that is general enough that you can reuse it on a different project, so effectively you end up having to write a bespoke script each time, which is very time-consuming.
5) You can use the Python package Iris, which calls this kind of conversion a 'mesh regridding'. See here, but note that I couldn't work out how to use this for my data so I can't help with it.
6) You can load into ArcGIS and get ArcGIS to convert to 2D. Marcus Buechel kindly provided these tips in August 2019: "Converting the 1D output files produced by JULES when land_only=.true. into a more conventional 2D raster grid can be achieved using ArcMap. As far as I am aware the following tools have been available in ArcMap since version 10.3. As the output files are not produced on a regular latitude/longitude grid, you have to use the Make NetCDF Feature Layer in the Multidimension Toolbox, rather than Make NetCDF Raster Layer. The inputs are such:
- Input the NetCDF file you wish to convert/visualise.
- Select the variable(s) that you want to investigate.
- Select ‘longitude’ as the X Variable and ‘latitude’ as the Y Variable.
- Give your output file an appropriate name.
- For the Row Dimensions box, select ‘x’. This is very important!
- Finally select ‘time’ in the Dimension Values box.
- Click OK to run the tool.


